In the world of financial markets, technical analysis stands as a cornerstone for traders and investors. It is not merely about speculating; it is about understanding the language of the market through chart patterns and indicators. By deciphering these signals, traders gain insights into potential price movements and make informed decisions.
In this article, we will delve deep into the realm of technical analysis, focusing on chart patterns and indicators—the twin pillars that guide many successful traders.
Understanding Chart Patterns
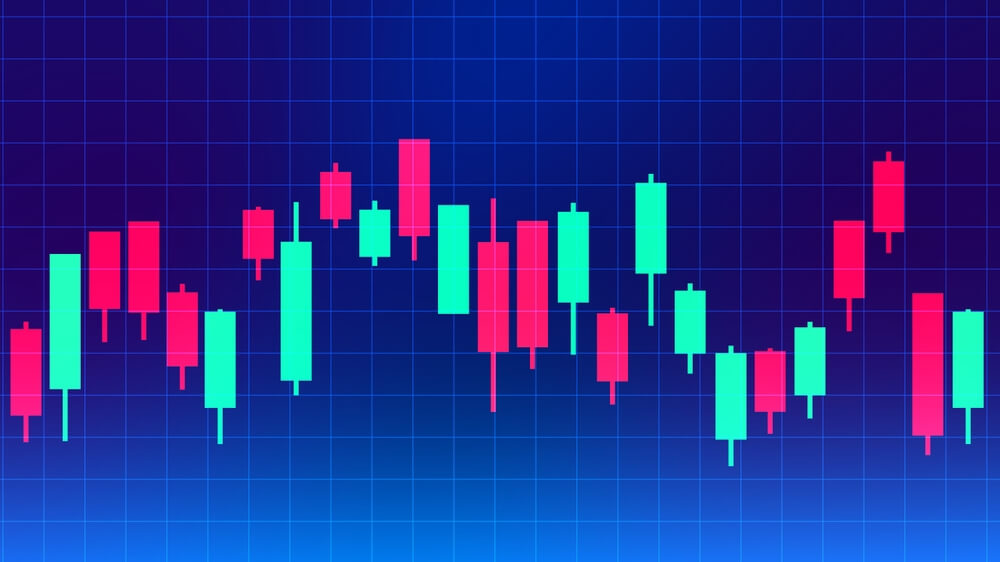
Before diving into the intricacies of chart patterns, let’s grasp the essence of their significance. Chart patterns are graphical representations of historical price movements, showcasing recurring formations that often precede significant price changes. These patterns, when understood and identified correctly, provide traders with invaluable insights into potential market directions.
Reversal patterns indicate potential shifts in market sentiment. Examples include the head and shoulders pattern, double tops, and double bottoms. These patterns signal the end of an existing trend and the beginning of a new one, making them crucial for traders looking to capitalise on trend reversals. Continuation patterns, as the name suggests, signify a pause in the ongoing trend before it resumes. Patterns like flags, pennants, and triangles are common examples. Traders use these patterns to confirm the strength of the prevailing trend and position themselves for potential profit opportunities when the trend resumes.
Bilateral patterns, also known as symmetrical patterns, represent indecision in the market. Examples include rectangles and wedges. These patterns indicate a period of consolidation, where neither bullsnor bears have gained control. Traders monitor these patterns closely, as they often precede significant breakouts or breakdowns in price.
Exploring Key Technical Indicators
While chart patterns provide valuable visual cues, technical indicators offer quantitative insights into market trends and momentum. These mathematical calculations, applied to historical price data, generate signals that help traders make informed decisions.
Trend indicators, such as moving averages and trendlines, help traders identify the direction and strength of market trends. By smoothing out price fluctuations, these indicators provide a clear picture of whether the market is trending upwards, downwards, or consolidating. Momentum indicators, such as the Relative Strength Index (RSI) and the Moving Average Convergence Divergence (MACD), measure the speed and magnitude of price changes. These indicators help traders identify overbought or oversold conditions, as well as potential trend reversals.
Volatility indicators, such as Bollinger Bands and Average True Range (ATR), quantify the degree of price fluctuation in the market. Traders use these indicators to assess the level of risk and adjust their trading strategies accordingly. Volume indicators, such as On-Balance Volume (OBV) and Chaikin Money Flow (CMF), track the volume of trading activity in the market. By analysing volume patterns, traders gain insights into the strength and conviction behind price movements.
Visit Saxo markets to apply your knowledge about technical indicators in practice.
Integrating Patterns and Indicators
While chart patterns and indicators offer valuable insights on their own, combining them can amplify their effectiveness. By using indicators to confirm the validity of chart patterns, traders can increase their confidence in their trading decisions and reduce the risk of false signals.
Traders can use technical indicators to confirm the signals generated by chart patterns. For example, when identifying a bullish reversal pattern such as a double bottom, traders can look for confirmation from momentum indicators such as the RSI or MACD. If these indicators show bullish divergence or positive momentum, it adds credence to the bullish reversal signal.
Common Mistakes to Avoid
One common mistake is overreliance on indicators or patterns without considering other factors such as fundamental analysis or market sentiment. While technical analysis can provide valuable insights, it should be used in conjunction with other analytical tools for a more comprehensive understanding of the market.
Another mistake is ignoring fundamental analysis altogether. While technical analysis focuses on price movements and market psychology, fundamental analysis examines the underlying factors that drive asset prices, such as economic indicators, company earnings, and geopolitical events. Ignoring fundamental analysis can lead to missed opportunities or misinterpretation of market trends.
Finally, failing to adapt to changing market conditions can be detrimental to traders. Markets are dynamic and constantly evolving, and strategies that work in one market environment may not be effective in another. Traders must be flexible and adaptive, continuously monitoring market developments and adjusting their strategies accordingly.
Best Practices for Successful Analysis
Discipline and patience are essential virtues for successful traders. It is important to stick to a trading plan and avoid emotional decision-making based on fear or greed. By maintaining discipline and patience, traders can avoid impulsive actions and stay focused on their long-term goals.
Backtesting is a crucial step in developing and refining trading strategies. By testing strategies against historical data, traders can assess their effectiveness and identify potential weaknesses or areas for improvement. Backtesting helps traders gain confidence in their strategies and provides valuable insights into their performance under different market conditions.
Conclusion
In conclusion, chart patterns and indicators serve as indispensable tools in the arsenal of a technical analyst. By understanding the nuances of chart patterns and indicators and integrating them into their analysis, traders can gain valuable insights into market dynamics and make informed trading decisions. However, it is essential to avoid common pitfalls, adhere to best practices, and continuously educate oneself to navigate the complexities of the financial markets successfully.